ShowAllResults Result
Design time only
Applies To
Vision Objects: ArcFinder, ArcInspector, Blob, BoxFinder, CodeReader, ColorMatch, Contour, CornerFinder, Correlation, DefectFinder, Edge, Geometric, LineFinder, LineInspector, OCR, Coordinates
Description
A button is placed in the ShowAllResults result value field which when clicked opens a dialog which shows all the results for this vision object. Used for Vision objects that return multiple results.
Remarks
The ShowAllResults result is a special type of results which allows the user to see all the results for a specific vision object. It is the most useful when there are multiple results for a specific vision object because you can see all the results at one time.
The ShowAllResults result was designed to make is easier to see multiple results all together in one place. Therefore, it is only available for those vision objects which support multiple results (ArcFinder, ArcInspector, Blob, BoxFinder, CodeReader, ColorMatch, CornerFinder, Correlation, DefectFinder, Edge, Geometric, LineFinder, LineInspector, OCR, Coordinates.)
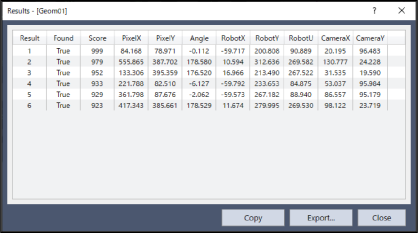
| Option | Description |
|---|---|
| Copy | Copies to the clipboard. |
| Export | Exports into a CSV file. |
| Close | Closes the [Results] dialog box. |
See Also
ArcFinder Object, ArcInspector Object, Blob Object, Correlation Object, DefectFinder Object, Edge Object, Geometric Object, LineFinder Object, LineInspector Object, CodeReader Object, OCR Object, BoxFinder Object, Contour Object, CornerFinder Object, Coordinates Object
The following extra features are available only with Epson RC+ Standard Edition or higher.
Applies To
Vision Object: Blob, Geometric
Description
A button is placed in the ShowAllResults result value field which when clicked opens a dialog which shows all the results for this vision object. Used for Vision objects that return multiple results.
Furthermore, the detection location can be visually confirmed and some detection properties can be adjusted.
Remarks
The ShowAllResults result is a special type of results which allows the user to see all the results for a specific vision object. It is the most useful when there are multiple results for a specific vision object because you can see all the results at one time.
The ShowAllResults result was designed to make is easier to see multiple results all together in one place. Therefore, it can be used with some vision objects (BloGeometric) that support multiple results.
You can check the detection location in the image by clicking and selecting an item in the list.
You can select multiple items by dragging in the list.
Multiple selections in the list
- Hold down the Ctrl key and click items in the list to simultaneously select multiple non-contiguous ranges.
- Hold down the Shift key and click items in the list to select a contiguous range.
- Press the Ctrl and A keys simultaneously to select all the items in the list.
List detection result output function
Press the Ctrl and C keys simultaneously to copy the selected items to the clipboard.
Result verification function
Clicking a detected position in the image display selects the corresponding item in the list.
Result sorting function
Click the top item in the list to sort the specified results in ascending or descending order.
Detection property adjustment function
For Blob Objects, you can adjust the MinArea and MaxArea properties.
For Geometric Objects, you can adjust Accept.
Blob Object
This displays a list of results for Blob objects.
By selecting multiple results from the list, you can check the Area range so that only the desired workpieces can be detected.
- Enabling the [Show All Results] checkbox displays the detection results for items not selected in the list in the image display area. Deselect this checkbox to display only the items currently selected in the list in the image display area.
- Enabling the [Show No] checkbox displays the detection number in the image display.
- Enabling the [Show Area] checkbox displays the Area results in the image display.
- Clicking the [Discard Changes] button allows you to restore the settings.
- Adjust MinArea and MaxArea
- This feature allows you to visually adjust the MinArea and MaxArea properties.
- The horizontal axis represents the Area and the vertical axis of the bar graph represents the number of items for each Area. The line graph shows the cumulative sum of the number of items for each Area from left to right.
- You can adjust the MinArea property by moving the MinArea slider at the left to the left or right. While you are adjusting the slider, the system selects the detection results so that the Area results fall within the range of MinArea to MaxArea.
- You can adjust the MaxArea property by moving the MaxArea slider at the right to the left or right. While you are adjusting the slider, the system selects the detection results so that the Area results fall within the range of MinArea to MaxArea.
- Adjust the slider to the left or right to enclose the high points in the bar graph or the steepest slopes in the line graph.
- Clicking the [Refresh Data] button allows you to update the screen to the applied setting value.
- To expand the range of the slider, click the Expand button (
) on the right and left side.
- Clicking the [Apply Area Range & Close] button applies the settings and closes the screen.
- Enabling the [Show Cumulative Graph] checkbox displays a line graph.
- Enabling the [Show Detection Count Graph] displays a bar graph.
- From the [Aggregation Interval] dropdown list, you can specify the display granularity of the bar graph.
Geometric Object
This displays a list of results for Geometric objects.
By selecting multiple results from the list, you can check the Accept range so that only the desired workpieces can be detected.
- Enabling the [Show All Results] checkbox displays the detection results for items not selected in the list in the image display area. Deselect this checkbox to display only the items currently selected in the list in the image display area.
- Enabling the [Show No] checkbox displays the detection number in the image display.
- Enabling the [Show Score] checkbox displays the Score results in the image display.
- Clicking the [Discard Changes] button allows you to restore the settings.
- Adjust Score
- This feature allows you to visually adjust the Score property.
- The horizontal axis represents the Score and the vertical axis of the bar graph represents the number of items for each Score. The line graph shows the cumulative sum of the number of items for each Score from left to right.
- The Accept property can be adjusted by moving the Accept slider on the left to the left or right. While you are adjusting the slider, the system selects the detection results so that the Score results fall within Accept.
- Adjust the slider to the left or right to enclose the high points in the bar graph or the steepest slopes in the line graph.
- Clicking the [Refresh Data] button allows you to update the screen to the applied setting value.
- To expand the range of the slider, click the Expand button (
) on the right and left side.
- Clicking the [Apply Accept & Close] button applies the settings and closes the screen.
- Enabling the [Show Cumulative Graph] checkbox displays a line graph.
- Enabling the [Show Detection Count Graph] displays a bar graph.
- From the [Aggregation Interval] dropdown list, you can specify the display granularity of the bar graph.