[Mode]-[Log] button
Details of the displayed dialog box
Select [Mode]-the [Log] button to display the following dialog box.
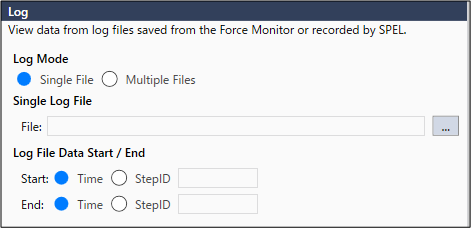
When the [Single File] button is selected

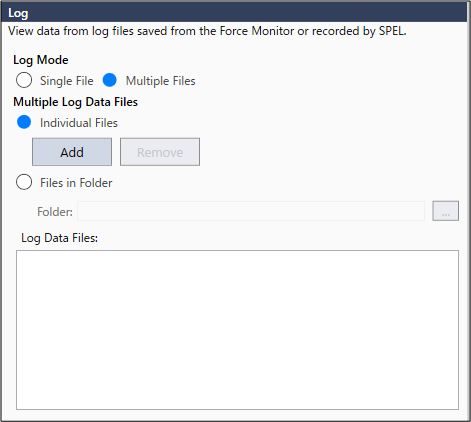
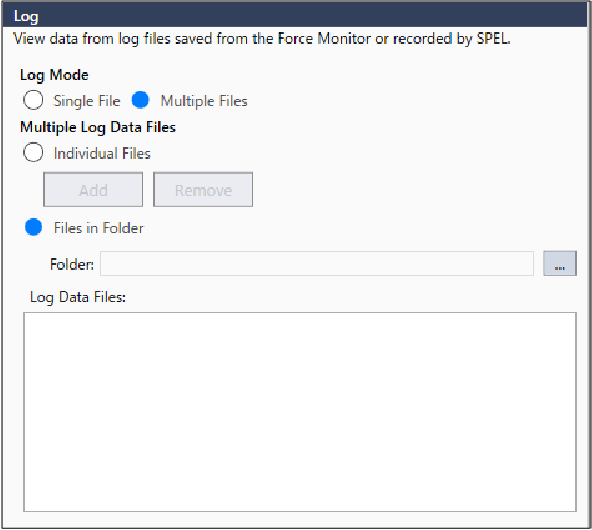
When the [Multiple Files] button is selected

Item | Description |
|---|---|
| Graph area | Force information or positional information of the robot which is saved in a file is displayed in a graph. You can select several files and compare them on the graph. |
When selecting a single file: There are [Force], [1D Pos], [2D Pos], and [Pos Diff] tabs in graph area. | |
When selecting multiple files: There are [Force], [torque], [2D Pos], and [Pos Diff] tabs in the graph area. | |
You can switch a tab depending on usage. For details of each tab, refer to the following section. | |
| Single File | Display a single log data file on a graph. You can analyze or check it. |
| Single Log File | Set a log data file to display. Select a target file from the [Select Data File] dialog box of log data file. Click the [Open] button to display it on a graph. |
| Log File Data Start / End | Set a display range of the log data. Time : Set a start time or an end time (sec). StepID : Set StepID to start or end. |
| Multiple Files | Overlay multiple log data files on a graph to display. You can compare them or check variations. |
| Multiple Log Data Files | You can select the either one of the following loading methods by clicking the [Multiple Files] button. Individual Files Files in Folder |
[Individual Files] button: You can add or remove a target file in a unit of file. [Add] Button The [Select Data File] dialog box is displayed. Select a target file and click the [Open] button to add the file. [Remove] button: Select and click the target files to be removed from a list of log data files. Removal message is displayed. Click the [Yes] button and remove the file. | |
[Files in Folder] button: You can select a target file in a unit of folder. Folder: Click the button to display the reference dialog box of the folder. Select a target folder and click the [OK] button to add the file. | |
Added file is displayed on the [Log Data Files]. Files with checkmarks are displayed on graph. You can display up to 50 files on a graph simultaneously. |
How to Load a Single Log File
- Select the [Single File] button.
- Click the button shown below.
[File]-[ ]
] - The [Select Data File] dialog box is displayed.
Select a target file in the [File name] box.
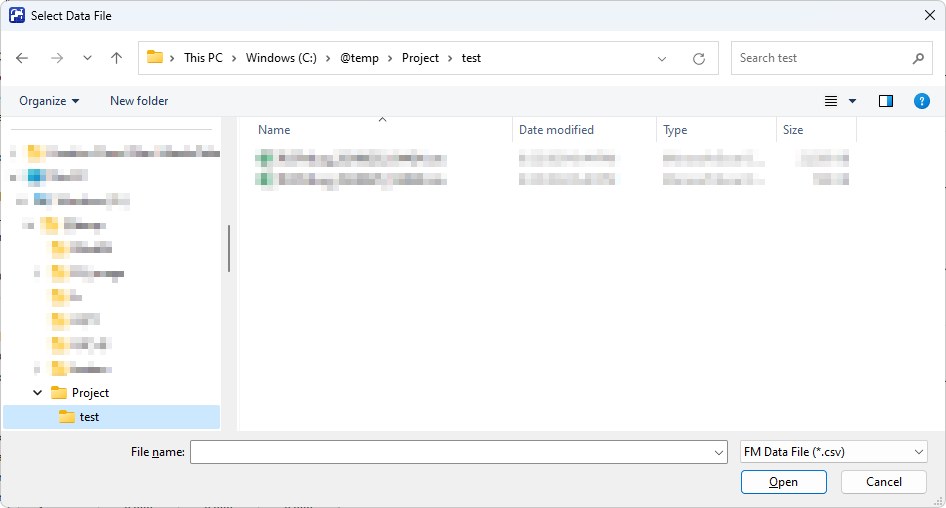
- Click the [Open] button.
Log data is displayed in the graph.

How to Load Multiple Log Data Files
Select individual files
- Click the [Multiple Files] button.
- Select the [Individual Files] button.
- Click the [Add] button. The [Select Data File] dialog box is displayed.
- Select a target file in the [File name] box.
- Click the [Open] button.
File is added to the [Log Data Files]. When placing a checkmark in the checkbox, the log data is displayed in the graph.

Key Point
When you restart the [Force Monitor] dialog box while the check marks are placed in the checkboxes of the files displayed in [Log Data Files], it will take time to load the files.
When you want to add files to be displayed on a graph:
Click the [Add] button.When you want to remove a file to be displayed from a graph:
There are two methods.Remove a check mark from the list of [Log Data Files].
Select the target file and click the [Remove] button. When you click the [Remove] button, the following message is displayed.
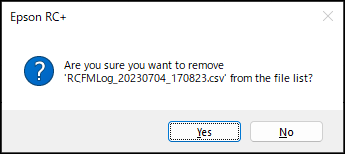
Confirm the message and click the [Yes] button. Target file is removed from the list of [Log Data Files].

Select a folder
- Click the [Multiple Files] button.
- Click the [Files in Folder] button.
- Click the button shown below.
[File]-[ ] - The [Browse for Folder] dialog box appears.
Select a target folder.
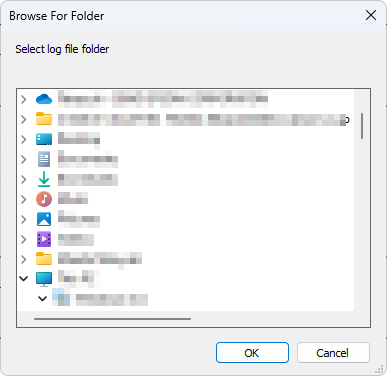
- Click the [OK] button. File is added to the [Log Data Files].

When placing a checkmark in the checkbox, the log data is displayed in the graph.
