Graph
Select items to be displayed on the check box next to the graph.
- With a checkmark: Display the selected items in a graph.
- Without a checkmark: The selected items are not displayed in a graph.
Single File
[Force] tab (Single File)
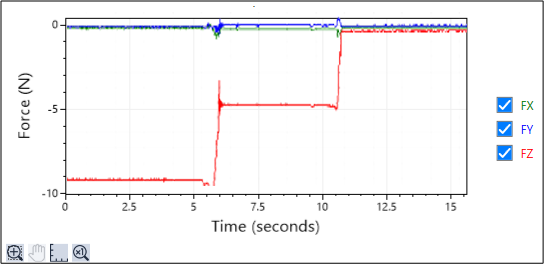
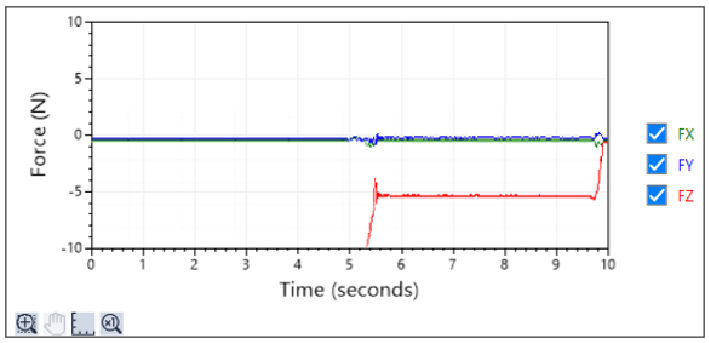
Graph on the [Force] tab displays the translational force, torque and StepID values.

When selecting the [Force] tab in the following modes, the graph is displayed.
- Live mode
- Runtime mode
- Log mode (select the [Single File] button)
Item | Description |
|---|---|
| Force graph | Display the translational force (Fx, Fy, Fz) in a graph. Vertical axis: Force [N] Horizontal axis: Time [s] Changes of StepID are displayed in a graph with a red line. |
| Torque graph | Display torque (Tx, Ty, Tz) in a graph. Vertical axis: Torque [N・mm] Horizontal axis: Time [s] Changes of StepID are displayed in a graph with a red line. |
| Force / Torque Data | For the translational force (Fx, Fy, Fz) and torque (Tx, Ty, Tz), display the values (last, average, minimum, and maximum) of the data displayed in a graph. |
[1D Pos] tab (Single File)
The graphs on the [1D Pos] tab display the (CurPos) command position (which includes force control) and the (RefPos) command position (which includes only position control), divided into their X, Y, and Z components.

When selecting the [1D Pos] tab in the following modes, the graph is displayed.
- Live mode
- Runtime mode
- Log mode (select the [Single File] button)
Item | Description |
|---|---|
| Position X graph | Display the command positions (CurPos and RefPos) in X direction in a graph. Vertical axis: Position in X direction [mm] Horizontal axis: Time [s] |
| Position Y graph | Display the command positions (CurPos and RefPos) in Y direction in a graph. Vertical axis: Position in Y direction [mm] Horizontal axis: Time [s] |
| Position Z graph | Display the command positions (CurPos and RefPos) in Z direction in a graph. Vertical axis: Position in Z direction [mm] Horizontal axis: Time [s] |
| Position Data | For each component of X, Y, and Z of each command position, display the values (last, average, minimum, and maximum) of the data displayed in a graph. |
[2D Pos] tab (Single File)
The graphs on the [2D Pos] tab displays graphs of the (CurPos) command position (which includes force control) and the (RefPos) command position (which includes position control only), divided into XY, YZ, and XZ planes.

When selecting the [2D Pos] tab in the following mode, the graph is displayed.
- Live mode
- Runtime mode
- Log mode (select the [Single File] button)
Item | Description |
|---|---|
| XY plane from +Y axis view graph | Display the command positions (CurPos and RefPos) projected on XY plane in a graph. Vertical axis: Position in Y direction [mm] Horizontal axis: Position in X direction [mm] |
| YZ plane from +Y axis view graph | Display the command positions (CurPos and RefPos) projected on YZ plane in a graph. Vertical axis: Position in Z direction [mm] Horizontal axis: Position in Y direction [mm] |
| XZ plane from +Y axis view graph | Display the command positions (CurPos and RefPos) projected on XZ plane in a graph. Vertical axis: Position in Z direction [mm] Horizontal axis: Position in X direction [mm] |
| Command Position | You can select command positions to be displayed in the right bottom check boxes (Current Position and Reference Position). With a checkmark: Display the selected command positions in a graph. Without a checkmark: The selected command positions are not displayed in a graph. This setting is reflected to all graphs. |
[Pos Diff] tab (Single File)
Graph on the [Pos Diff] tab displays the difference between the command position (CurPos) including force control and the command position (RefPos) only including position control on the graph by dividing them into each component: X, Y, and Z.

When selecting the [Pos Diff] tab in the following modes, the graph is displayed.
- Live mode
- Runtime mode
- Log mode (select the [Single File] button)
Item | Description |
|---|---|
| Pos Diff X graph | Display the position difference of the command positions (CurPos and RefPos) in the X direction in a graph. Vertical axis: Positional difference in X direction [mm] Horizontal axis: Time [s] |
| Pos Diff Y graph | Display the position difference of the command positions (CurPos and RefPos) in the Y direction in a graph. Vertical axis: Positional difference in Y [mm] Horizontal axis: Time [s] |
| Pos Diff Z graph | Display the position difference of the command positions (CurPos and RefPos) in the Z direction in a graph. Vertical axis: Positional difference in Z [mm] Horizontal axis: Time [s] |
| Position Difference Data | For each component of Pos Diff: X, Y, and Z, display the values (last, average, minimum, and maximum) of the data displayed in a graph. |
Multiple Files
[Force] tab (Multiple Files)
Graph on the [Force] tab (multiple files) displays the translational force on a graph for each axis.
Data of multiple log data files which are specified on each graph is overlaid to display.

When selecting the [Force] tab in the following modes, the graph is displayed.
- Log mode (select the [Multiple Files] button)
Item | Description |
|---|---|
| Fx graph | Overlay the translational force in X direction up to 50 files on the graph and display. Vertical axis: Force in X direction [N] Horizontal axis: Time [s] |
| Fy graph | Overlay the translational force in Y direction up to 50 files on the graph and display. Vertical axis: Force in Y direction [N] Horizontal axis: Time [s] |
| Fz graph | Overlay the translational force in Z direction up to 50 files on the graph and display. Vertical axis: Force in Z direction [N] Horizontal axis: Time [s] |
[Torque] tab (Multiple Files)
Graph on the [Torque] tab displays the torque on a graph for each axis.
Data of multiple log data files which are specified on each graph is overlaid to display.

When selecting the [Torque] tab in the following mode, the graph is displayed.
- Log mode (select the [Multiple Files] button)
Item | Description |
|---|---|
| Tx graph | Overlay the torque in X direction up to 50 files on the graph and display. Vertical axis: Torque in X direction [N・mm] Horizontal axis: Time [s] |
| Ty graph | Overlay the torque in Y direction up to 50 files on the graph and display. Vertical axis: Torque in Y direction [N・mm] Horizontal axis: Time [s] |
| Tz graph | Overlay the torque in Z direction up to 50 files on the graph and display. Vertical axis: Torque in Z direction [N・mm] Horizontal axis: Time [s] |
[1D Pos] Tab (Multiple Files)
The graphs on the [1D Pos] tab display the (CurPos) command position (which includes force control) and the (RefPos) command position (which includes only position control), divided into their X, Y, and Z components. Data of multiple log data files which are specified on each graph is overlaid to display.

When selecting the [1D Pos] tab in the following modes, the graph is displayed.
- Log mode (select the [Multiple Files] button)
Item | Description |
|---|---|
| Position X graph | Overlay the command positions (CurPos and RefPos) in X direction up to 50 files on the graph and display. Vertical axis: Position in X direction [mm] Horizontal axis: Time [s] |
| Position Y graph | Overlay the command positions (CurPos and RefPos) in Y direction up to 50 files on the graph and display. Vertical axis: Position in Y direction [mm] Horizontal axis: Time [s] |
| Position Z graph | Overlay the command positions (CurPos and RefPos) in Z direction up to 50 files on the graph and display. Vertical axis: Position in Z direction [mm] Horizontal axis: Time [s] |
[2D Pos] Tab (Multiple Files)
The graphs on the [2D Pos] tab displays graphs of the (CurPos) command position (which includes force control) and the (RefPos) command position (which includes position control only), divided into XY, YZ, and XZ planes.
Data of multiple log data files which are specified on each graph is overlaid to display.

When selecting the [2D Pos] tab in the following mode, the graph is displayed.
- Log mode (select the [Multiple Files] button)
Item | Description |
|---|---|
| XY plane from +Y axis view graph | Display the command positions (CurPos and RefPos) projected on the XY plane by overlaying up to 50 files on the graph. Vertical axis: Position in Y direction [mm] Horizontal axis: Position in X direction [mm] |
| YZ plane from +Y axis view graph | Display the command positions (CurPos and RefPos) projected on the YZ plane by overlaying up to 50 files on the graph. Vertical axis: Position in Z direction [mm] Horizontal axis: Position in Y direction [mm] |
| XZ plane from +Y axis view graph | Display the command positions (CurPos and RefPos) projected on the XZ plane by overlaying up to 50 files on the graph. Vertical axis: Position in Z direction [mm] Horizontal axis: Position in X direction [mm] |
[Pos Diff] tab (Multiple Files)
Graph of the [Pos Diff] tab (Multiple Files) displays the difference between the command position (CurPos) including force control and the command position (RefPos) only including position control on the graph by dividing them into each component: X, Y, and Z.
Data of multiple log data files which are specified on each graph is overlaid to display.

When selecting the [Pos Diff] tab in the [Log] mode which selected several files, the graph is displayed.
Item | Description |
|---|---|
| Pos Diff X graph | Display the positional difference of the command positions (CurPos and RefPos) in X direction by overlaying up to 50 files on the graph. Vertical axis: Positional difference in X direction [mm] Horizontal axis: Time [s] |
| Pos Diff Y graph | Display the positional difference of the command positions (CurPos and RefPos) in Y direction by overlaying up to 50 files on the graph. Vertical axis: Positional difference in Y [mm] Horizontal axis: Time [s] |
| Pos Diff Z graph | Display the positional difference of the command positions (CurPos and RefPos) in Z direction by overlaying up to 50 files on the graph. Vertical axis: Positional difference in Z [mm] Horizontal axis: Time [s] |
Common functions
There are the following functions common for each graph.
- Enlarged display of graph
- Move an enlarged area
- Change of graph scale
- Display default size of graph
You can use the above functions when the graph is not updating.
![]()
Item | Description |
|---|---|
| Enlarged display of graph | Click the When the cursor moves over the graph, it changes to a cross-hair cursor. Then, an area from the start position to the end position will be enlarged. To return to the original graph, click the Instead of clicking button, you can display enlarged graph by rolling the mouse wheel on the graph. Also while clicking the mouse wheel on the graph and moving left and right, up and down, the graph is enlarged for each axis. |
| Move an enlarged area | Click the When the cursor moves on the graph, it changes to an arrow cursor. While left-clicking the enlarged area and moving left and right, up and down, the area moves with the mouse motion. Instead of clicking button, while right-clicking the mouse on the graph and moving left and right, up and down, the enlarged area moves with the mouse motion. |
| Change of graph scale | When the ( When set to "Auto", the scale changes automatically depending on the values. |
| Display default size of graph | If you click the Instead of clicking button, double-click the right mouse button on the graph to show the default size of the graph in the same way as clicking the enlarge graph button. |
Enlarge a graph
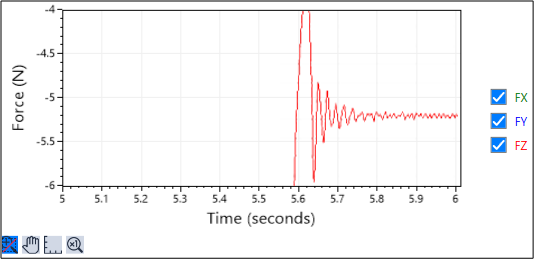
The following describes steps to enlarge the following ranges for the following graph. From -6.00N to -4.00N From 5 to 6sec
Method 1: Using the enlarge graph button ![]()
Click the ![]() button. When you click the button, it will change. (It shows the selected status.)
button. When you click the button, it will change. (It shows the selected status.)
![]()
- Move the mouse cursor over the graph.
- To select the area you want to enlarge, left-click the start position (5sec, -4.00N) and with the left mouse button held down, drag the cursor to the end position (6sec, -6.00N).
- Release the left mouse button. Display is switched to a range selected in the step (3).
Method 2: Using mouse wheel
- Roll the mouse wheel on the graph.
- Centered on the cursor position, the graph expands according to the rotation of the mouse wheel.
Also while clicking the mouse wheel on the graph and moving left and right, up and down, the graph is enlarged for each axis according to the movement of the mouse.
Move an enlarged area
The following describes steps to move the display range for the graph enlarged in the example of "Enlarge a graph".
Method 1: Using the move an enlarged area button ![]()
- Click the
 button.
When you click the button, it will change. (It shows the selected status.)

- Move the mouse cursor over the graph.
- Move the mouse to any position while left-clicking.
- Release the left mouse button. Display is switched to a position where is moved in the step (3).
Method 2: Using right-click
- Move the mouse cursor over the graph.
- Move the mouse to any position while right-clicking, and the enlarged area moves with the mouse motion.
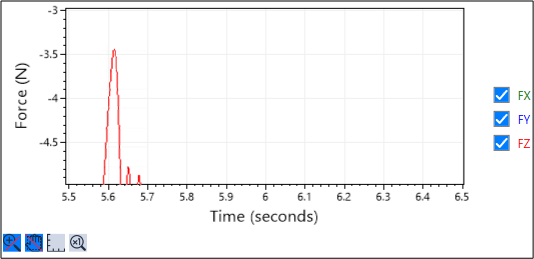
Example of changing a graph scale
The following describes steps to change the force scale to 10N and the time scale to 10sec for the following graph.
- Click the
 button. The [Set Graph Axis Scales] dialog box is displayed.
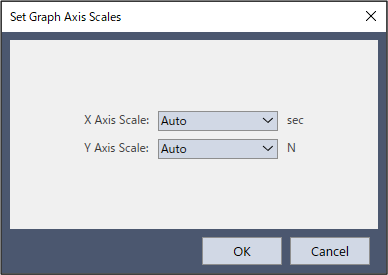
- Change the [Y Axis Scale] (force scale) to "10" and the [X Axis Scale] (time scale) to "10".
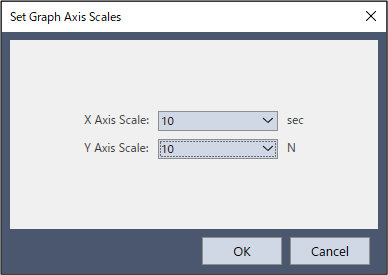
- Click the [OK] button. Display changes to the specified scale.
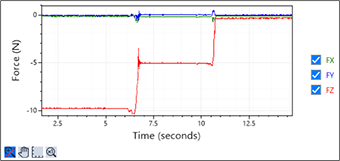
Restore the enlarged graph to its default display
The following explains how to restore the enlarged graph to its default display after enlarging the graph or moving the enlarged area.
- If the is selected, click the button to deselect it and return the graph display to its default.

- If the
 button is not selected, click the to return the graph display to its default.
 - Double-click the right mouse button on the graph to return the graph display to its default.