Motion Analysis by Monitor
The following describes how to use Epson RC+ to check the operation results of a force guide sequence.
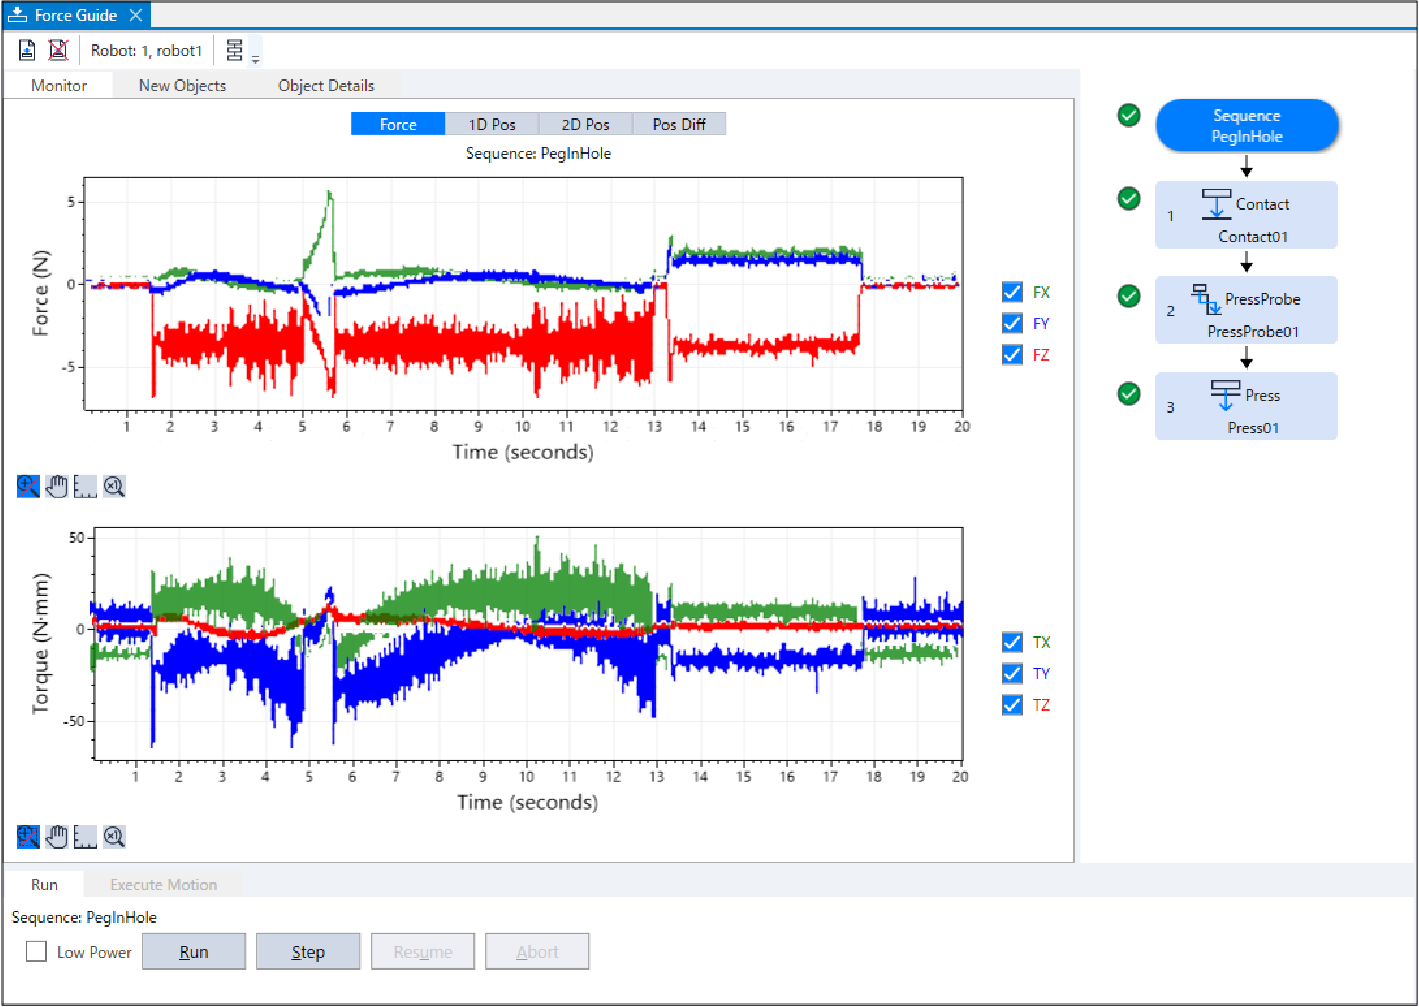
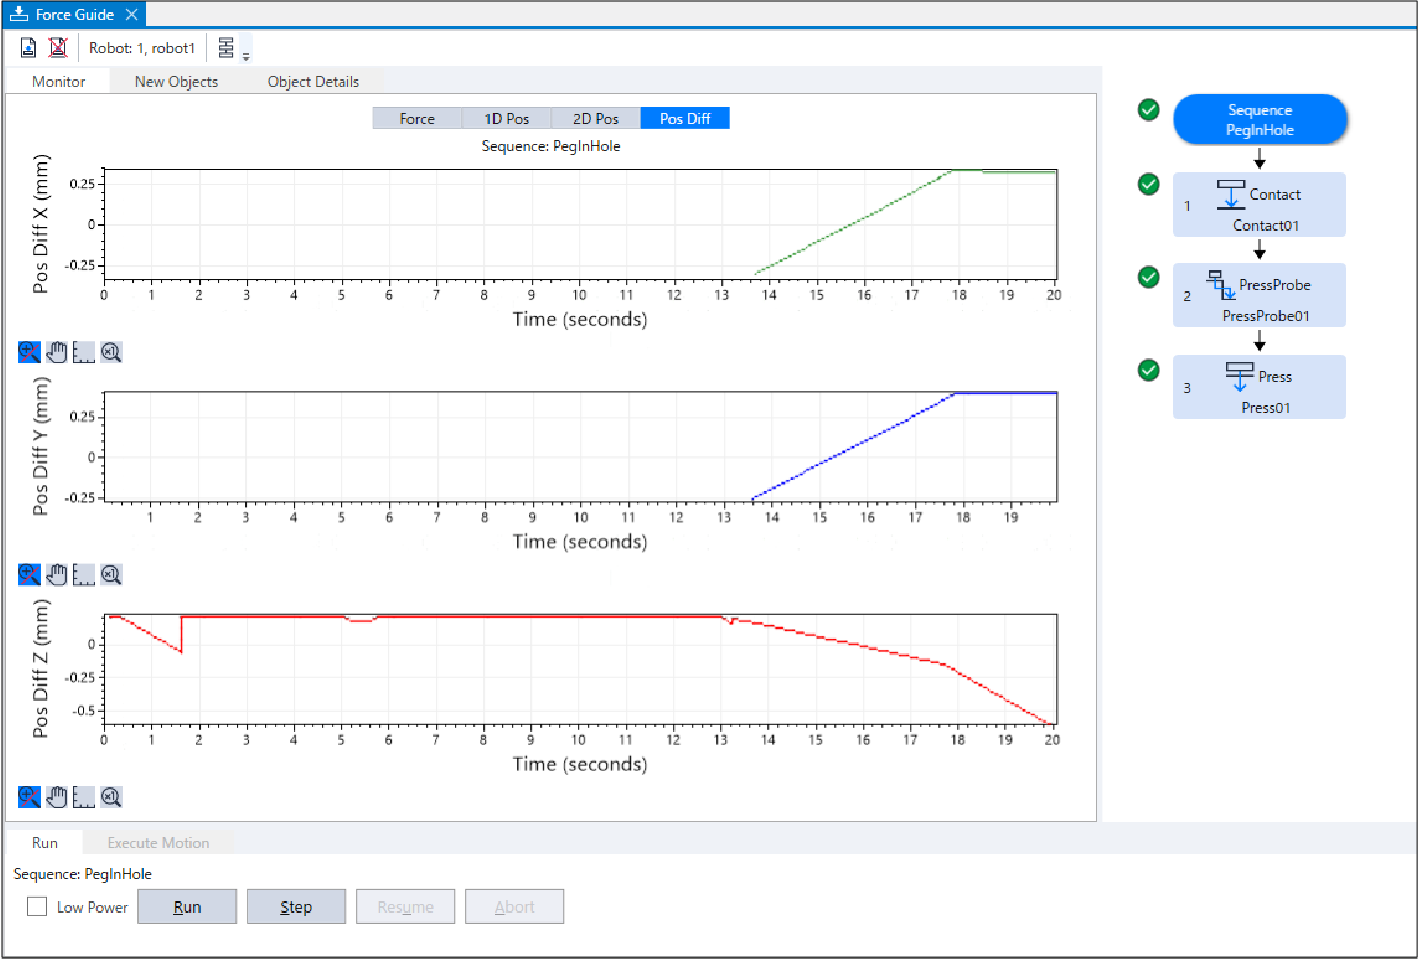
Display the [Force Guide] window.
Click the sequence flow of [PegInHole].
Select the [Monitor] tab. Select the [Force] tab. Force and position during the [PegInHole] sequence execution are displayed in the graph.
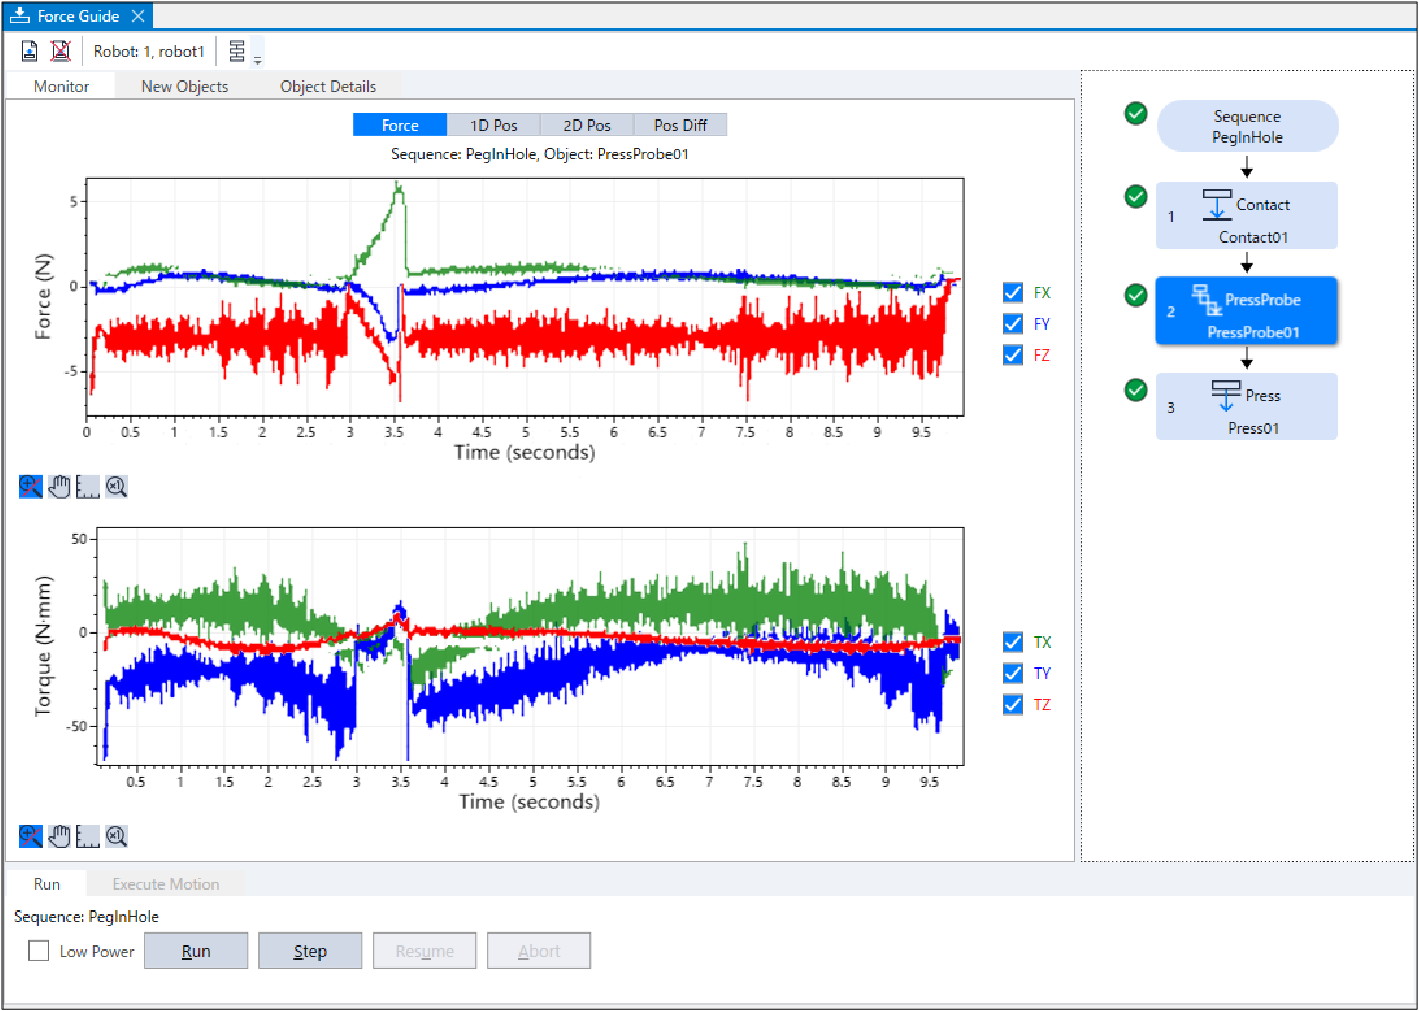
 Click the object flows of [Step1], [Step2], and [Step 3] to display the force and the position during the execution of the selected force guide object.
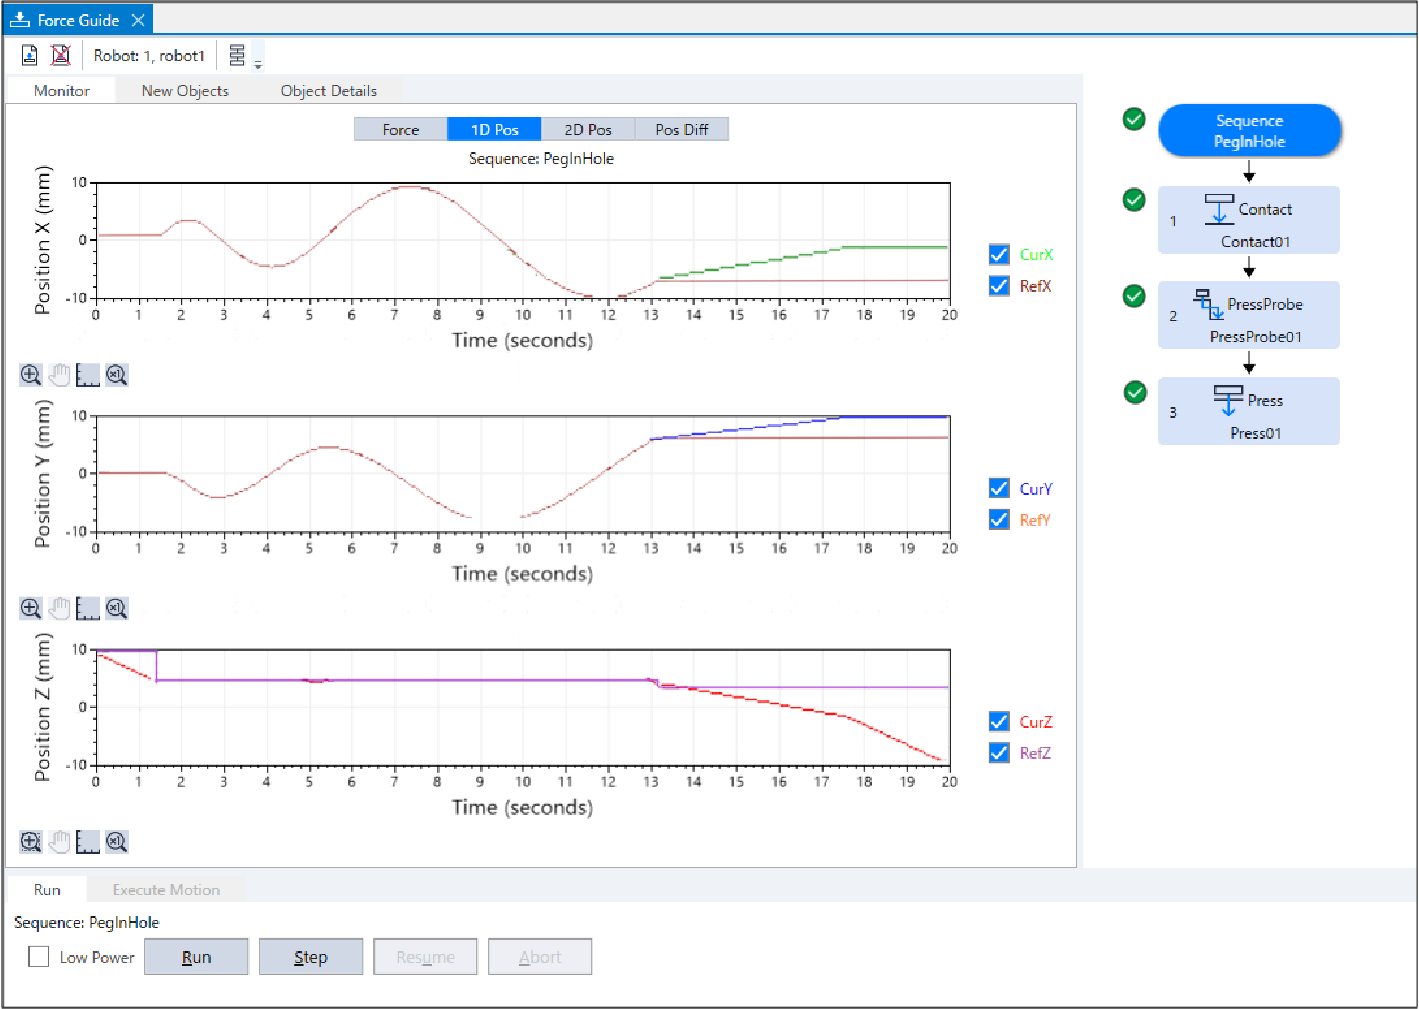
Click the sequence flow of [PegInHole]. Select the [Monitor] tab. Select the [1D Pos] tab. Graph for analysis is displayed. (horizontal axis: Time, vertical axis: Position)
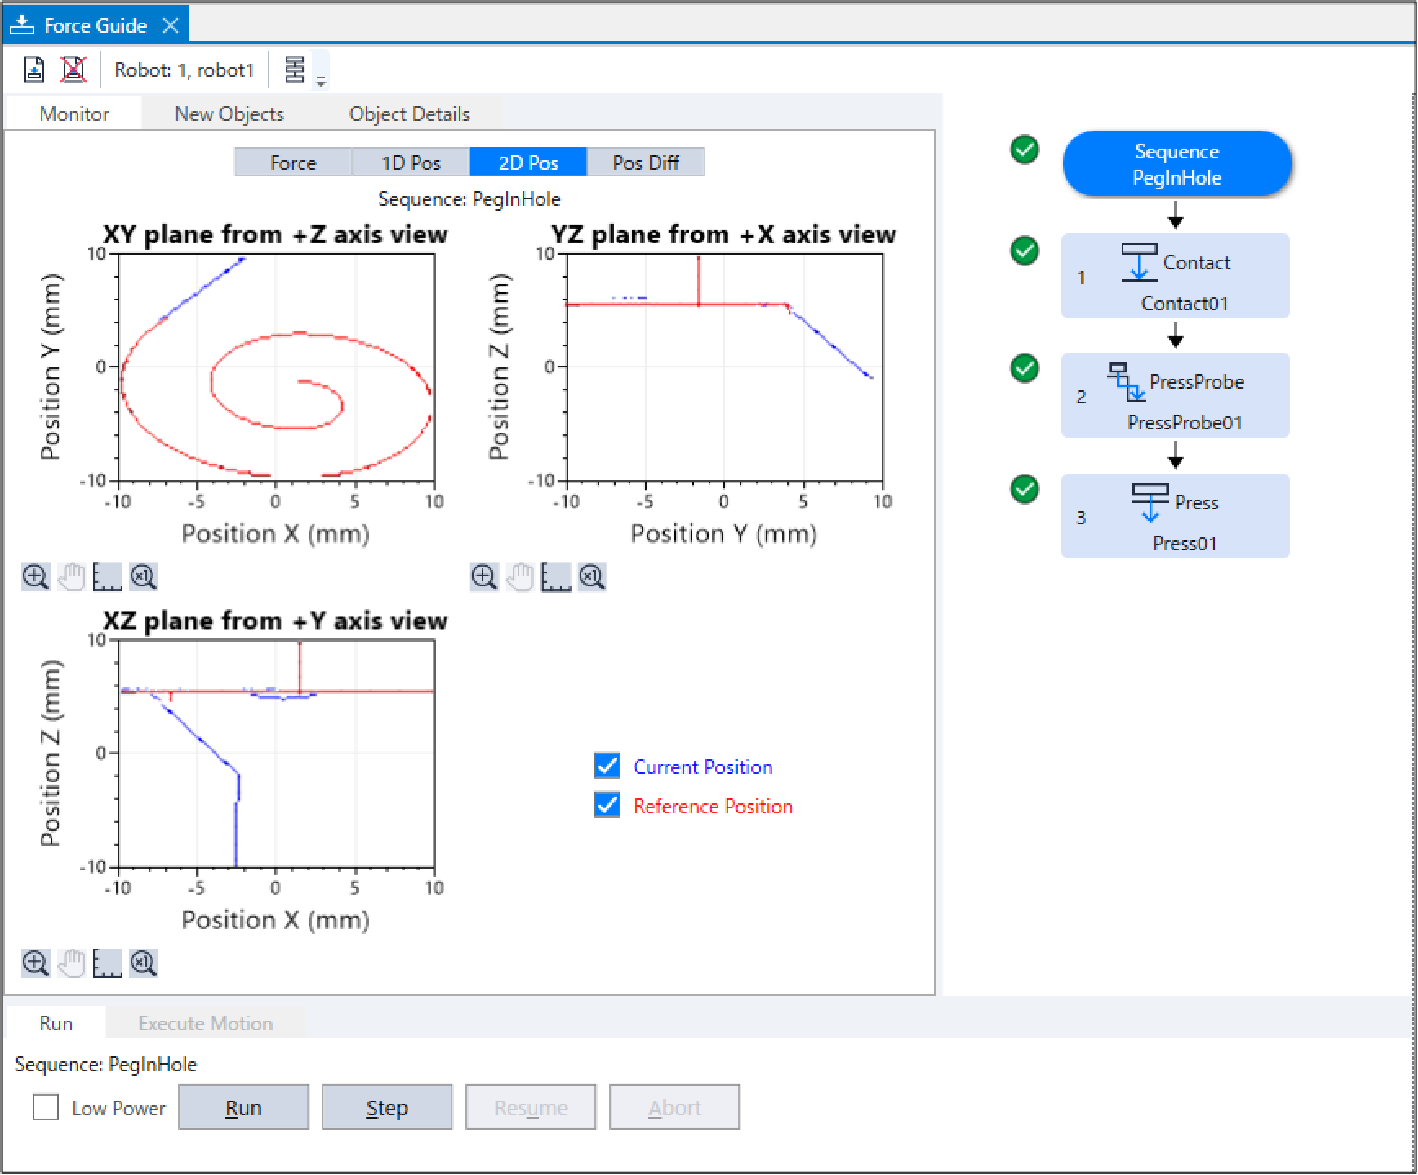
 Select the [2D Pos] tab. Graph for analysis is displayed. (horizontal axis, vertical axis: Position) Focus on the blue line. You can see that the robot enters into a hole while the spiral probe motion and the motion switches to the pressing motion. Then, the robot moves to -Z direction and moves (follows) inside the X, Y plane.
Select the [Pos Diff] tab. Record shifts by force control as relative position changes. It is different from the graph on the [1D Pos] tab.
 Change the unit of the graph and check the changes of force or positions.
Look the monitor shown by Tutorial and check the motion results. since the robot nearly entered a hole in [Step2]; however, it could not move downward more than 0.5mm, which is set in the position setting of [Plane Z].
